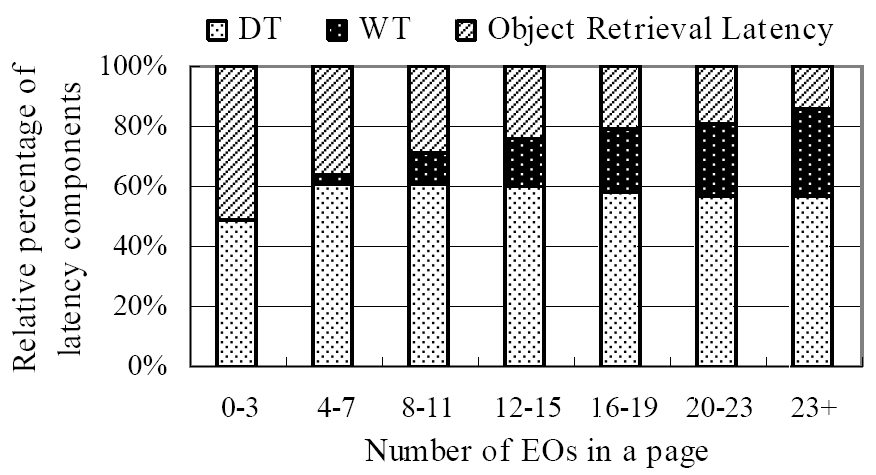
Figure II-3. Relative distribution of latency components showing that object overhead dominates web page latency